
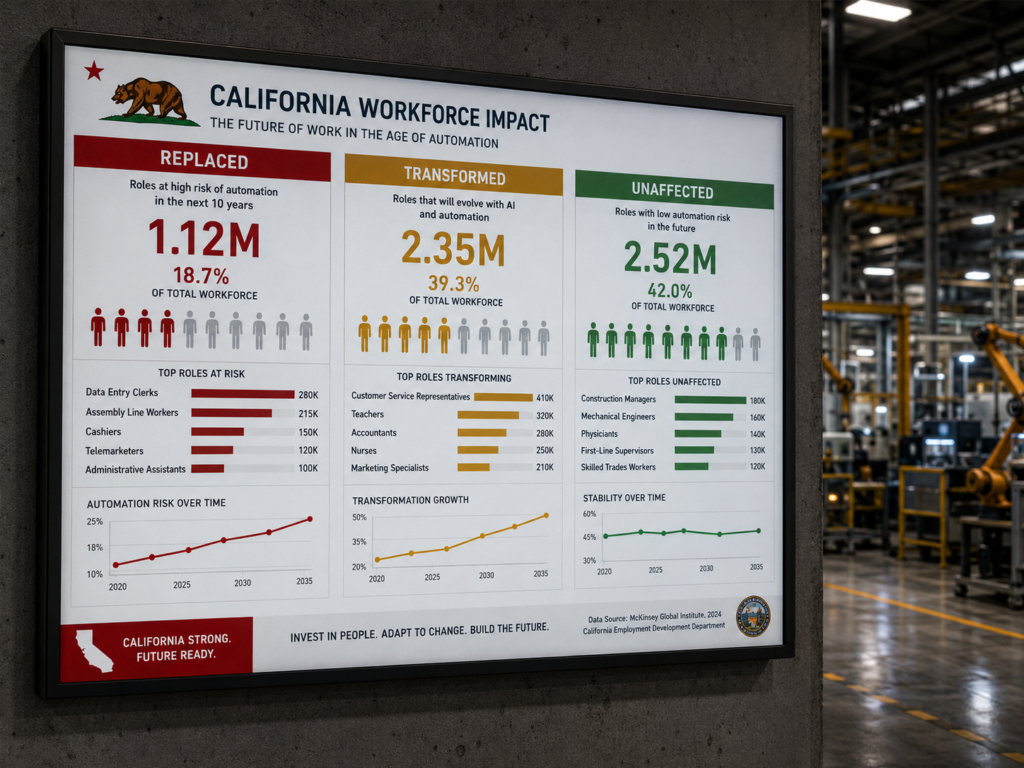
Updated October 22, 2026. California’s AI-Unemployment Tracker is a way to examine labor-market signals as AI tools spread. It should not be treated as a counter of jobs eliminated by AI. The distinction matters for anyone using its charts to make a staffing decision, write a headline or assess a training program.
What the state announced
California announced the tracker on June 25, 2026, describing a partnership between the California Policy Lab at UCLA and the Employment Development Department. The launch announcement said the initial analysis did not show a statewide rise in unemployment claims in AI-exposed occupations. It did identify patterns among some college-educated workers and in the San Francisco Bay Area.
The Labor & Workforce Development Agency’s July explanation describes monthly updates to unemployment-claim data and views by demographic characteristics, industry, region and AI-exposure score. Those features support monitoring; they do not establish the cause of an individual layoff.
Separate three different questions
| Question | What to check | What not to assume |
|---|---|---|
| How exposed is an occupation? | Read how its AI-exposure score is defined. | Exposure does not mean the work has already been automated. |
| Are unemployment claims changing? | Check the period, population and comparison group. | A change in claims is not the same measure as a change in total employment. |
| Did AI cause the change? | Look for a research design addressing other explanations. | A chart with two moving trends does not establish causation. |
A practical reading checklist
Start with the date. A finding in the launch report describes that report’s observation period, rather than every subsequent month. Record the latest data period shown in the tracker before quoting a result. This article does not claim to have independently analyzed its latest downloadable data.
Then identify the denominator. A percentage of claimants, a percentage change in claims and an unemployment rate answer different questions. A report should name the measure, the baseline and the group before presenting a percentage as evidence.
Compare like with like. Regional industry mixes, hiring cycles and eligibility for unemployment insurance can affect the patterns visible in claims. These are questions to investigate, not findings established by this article. Check the underlying report’s methods and limitations before making a causal claim.
How a publisher or employer can use the tracker
For a news article, link the relevant report and give the observation period beside the finding. Distinguish the researchers’ conclusion from your interpretation. If the data do not identify why someone lost a job, retain that uncertainty in the headline.
For workforce planning, use a signal to frame a question: which tasks are changing, which employees need support, and which additional evidence would justify an intervention? Do not use an occupation’s exposure score as an assessment of a particular employee’s performance or future.
The tracker can make discussion more specific. Its value depends on preserving the difference between an early warning, an observed change and an explanation for that change.
Primary sources
- Governor of California: tracker launch and initial findings, June 25, 2026
- California LWDA: tracker data and uses, July 24, 2026
Correction, October 22, 2026: Removed an unsupported claim of a 12% employment reduction, invented first-person reactions and conclusions that confused AI exposure with causation. Revised the headline to match the cited evidence. This is an AI-assisted explainer, not an independent analysis of the tracker’s current data.